Upon hearing the parameters of this task, I navigated to Google Analytics and started fumbling around trying to figure out how to combine the following dimensions into one view:
- Date
- Source / medium
- Campaign
Grabbing engine level data (such as Google Ads) is easy enough, but finding a succinct place to acquire website metrics with the above parameters from 6 different channels seemed like it was going to take some serious elbow grease every time we needed to run this report. Luckily, our senior marketing analytics manager had a solution.
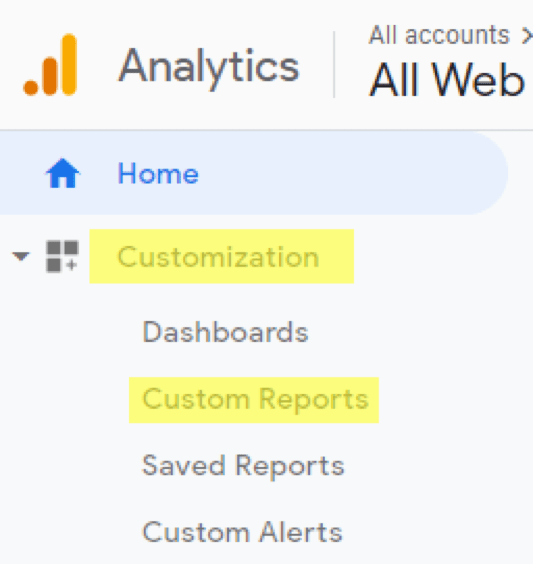
She directed me to a section within analytics that I had long forgotten about called ‘Custom Reports’ under the ‘Customization’ tab.

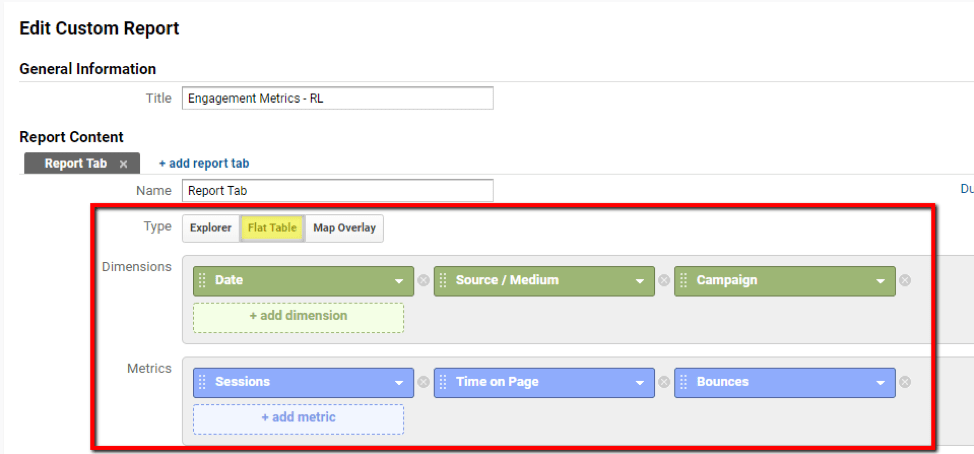
When I created a new custom report, Emileigh instructed me to ‘Select Flat Table’ as opposed to ‘Explorer’. This adjusted the report so we could now include multiple dimensions in conjunction with their corresponding site metrics. Which essentially meant that I now had a one-stop shop to grab all the data I needed with whatever time-frame was required as well, The setup looks like this:

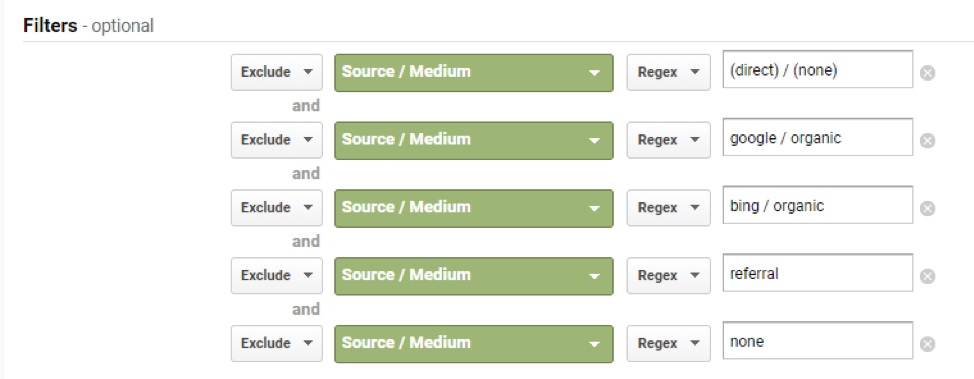
The report was a little bit of trial and error at first because I needed to add in addition filters to exclude direct traffic, organic traffic, referral traffic etc.:

After a few back-and-forths between the manifested report and the filters, we now have this report fine-tuned so that we can simply log into GA, click into the report, set the dates we need and viola; we can download all the website data needed into an excel file.
We of course still need to aggregate and marry this data with all the other downloads that come from the individual ad platforms when we conduct these reports, but for most use cases, this could be an extremely helpful (and time saving!) reporting practice. For more paid media tips, check out our PPC management services and for more analytics insights, check out the following blog post, what is web analytics.


