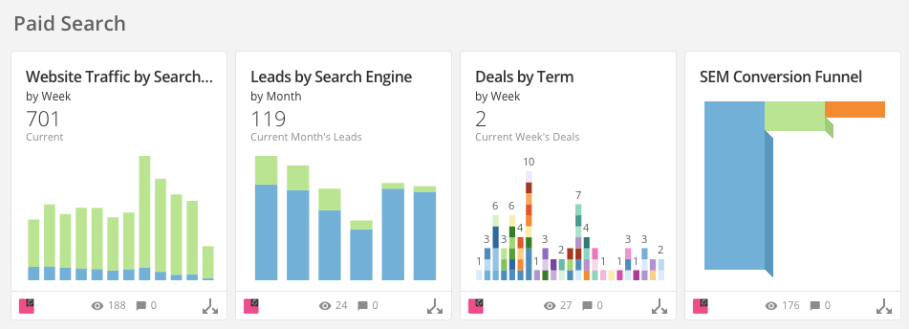
It’s true though—some of the dashboards that we can produce with digital marketing data are honestly pretty legit. Want to know what paid search terms are resulting in closed business? We can chart that. Want to know how leads are progressing through the funnel? Sure, just click on this handy little card in Domo (our digital marketing reporting platform of choice) and you can drill down and slice and dice the data as needed. There are literally full suites of reports and dashboards at your fingertips—like this handy little paid search dashboard we use for some of our digital clients.

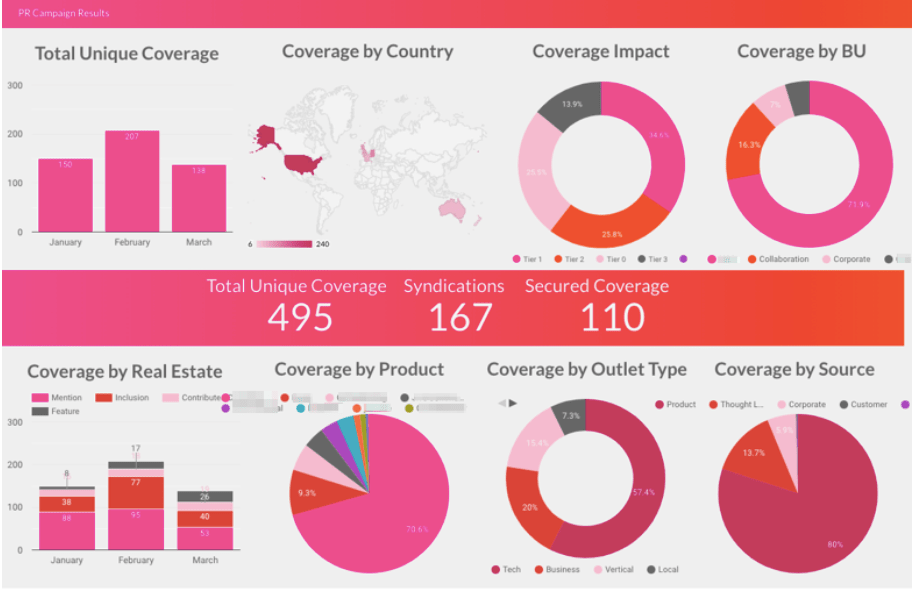
Those clients aren’t the only ones that get in on the dashboard and reporting fun though. We have a separate suite of reporting tools for our PR and Social clients, like this fancy Google Data Studio dashboard that makes it easy to see what’s going on at a glance. Different data source, different visualization method, same kind of awesomeness.

I mean, those charts look pretty cool right? We use them to present data in a way that’s easy to understand and supports actionable recommendations as to where to take your marketing program next. Is something going up and to the right? Great, let’s do more of that.
But what if I told you the data wasn’t real? What if I told you we had to fudge the numbers a bit, or some of the data was missing, or this was actually another client’s data? The charts are still going to look cool…but does any of it really matter if the data isn’t accurate?
Which leads us to the whole point of this post—that data integrity is the secret ingredient to digital marketing reporting. Without data integrity, your reporting is simply directional; it might as well be you saying, “my gut tells me this is what happened.” It’s not factual. It’s not useless…but it’s not as useful as it could be if you had confidence in your data. Unless your idea of ‘reporting’ is just creating a bunch of random charts in PowerPoint. Then yes, it’s useless.
Data integrity issues can manifest themselves in a number of ways, but the most common place we see it is when we’re reporting out of a CRM such as Salesforce. We’ll come across situations like:
- UTMs not properly being passed through on form submissions
- Lead Sources not documenting actual sources of leads
- Industry data showing up inconsistently because they haven’t been standardized
We’ll go to do monthly reporting, only to realize that a developer miscoded how forms handle UTMs, or Sales reps weren’t trained on what an MQL is, or their Marketing Automation platform is accidentally writing Lead Source to the Industry field. It messes up the data and decreases the accuracy of reporting.
The biggest issue we see is around standardization, and this applies to all kinds of marketing efforts. Does everyone know how certain information is being defined? Is there a consistent way marketing campaigns are tracked across media platforms? Is everyone involved with marketing efforts aligned on how information is being used? This foundational work—this standardization of data—is one of the single most important aspects of being able to effectively measure whether your work is working. Yes, it’s something that is consistently overlooked.
So how do we solve this problem? How do we ensure that those fancy looking charts are legitimate, and that the insights we’re basing off of them are real? Here are five things you can do to help improve your data integrity across digital marketing programs.
Agree on how UTMs are used
The effective use of UTMs allows for leads to be traced back to the source or campaign that brought them in, if they’re properly filled out. Don’t complicate this process. Standardize which UTMs you use and how you use them, and then use something like Google’s URL Builder to create them. Document how they’re used—or ask your agency what they recommend—and stick to it.
Collaborate with Sales teams on processes
We’re often asked to report on things like MQLs and Opportunities in specific stages, yet we consistently find that different people have different definitions of those very things. There needs to be a defined process for how you define something like an MQL, and all team members need to be held accountable for sticking to them. Education and communication are paramount—the most successful Sales and Marketing teams we see are the ones that find ways to collaborate effectively.
Make it someone’s responsibility
It’s not the most glamorous job, but someone needs to take ownership of ensuring that standard uses of fields are documented, and that people are sticking to that standardization. If it’s literally someone’s job to make this happen, there’s no ambiguity around where to go if things are not functioning properly. Ensuring data integrity is one of the most important aspects of proper reporting, and it should be clearly defined as someone’s responsibility.
Document everything
It always helps to have a handy little reference sheet to validate data against, to ensure processes are followed. These documents likely won’t be static, as new fields might be added and new processes established, but there should be a central place where people can go to understand how UTMs should be structured and how fields in CRMs are used. The same person that has ownership of validating data integrity should own documenting, literally, everything.
If all else fails-reset
It’s hard to go back to square one when it comes to data integrity and standardization. But sometimes a reset is required. Trying to put band aids on reporting along the way is not an effective way to consistently have faith in dashboards and charts. You’re always questioning the legitimacy of what’s being shown, and always unsure if things are directional or factual. If things really are as bad as they seem, take the time to stop, reset, and do it right. It will be worth it.
Want to learn more? Lucky for you, digital marketing analytics is one of the many things we do—and reporting (on good data) is a huge part of it. We have plenty of digital marketing services, and helping ensure clients’ data integrity actually makes reporting fun. There’s nothing better than seeing a dashboard that demonstrates success and knowing that it’s fact. Data integrity is the secret ingredient to digital marketing reporting—so go forth, standardize, and report with confidence.


